 BACK
BACK
Introducing the Portfolio Demand Map
Demand map enables real-time energy intelligence across a global portfolio of facilities
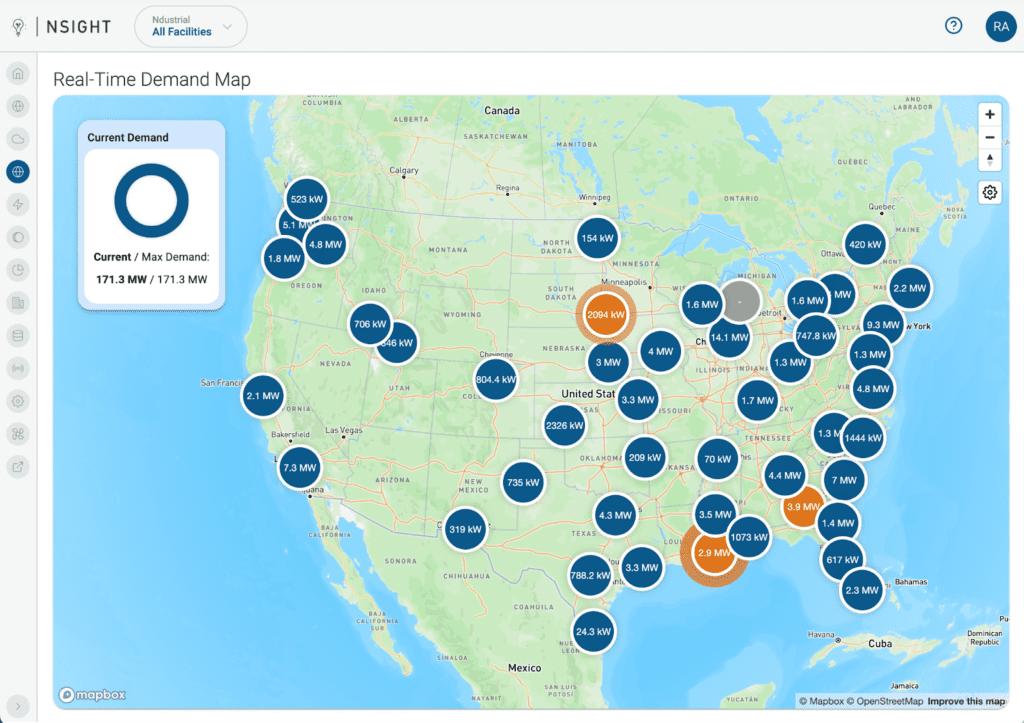
In the dynamic realm of industrial energy optimization, having real-time insights at your fingertips can make all the difference. Introducing the Nsight™ Portfolio Demand Map, a revolutionary module that transforms how organizations visualize and manage energy demand across their global portfolio. This cutting-edge feature leverages the robust capabilities of the Ndustrial real-time platform to provide unparalleled clarity and control.
What is the Nsight Portfolio Demand Map?
The Nsight Portfolio Demand Map is an interactive tool designed to aggregate and display real-time facility demand data across an entire organization’s portfolio. It integrates seamlessly into the Nsight platform, offering users a comprehensive view of energy consumption patterns worldwide through an intuitive map interface.
How Does the Demand Map Work?
At its core, the Portfolio Demand Map simplifies complex data into actionable insights:
– Visualization: Facilities are represented as markers on a global map, each indicating real-time demand levels.
– Color Coding: Markers are color-coded to provide instant insights:
– Orange: Indicates demand close to the maximum recorded in the last 72 hours, prompting proactive management.
– Blue: Shows demand below 90% of the maximum, highlighting areas with potential for optimization.
– Gray: Facilities without current demand data, signaling provisioning needs for full integration.

Key Features and Functionality
Current Demand Display
A prominent feature of the Demand Map is the dynamic donut chart, displaying the total current demand across all facilities alongside the highest demand recorded within the last 72 hours. This snapshot empowers decision-makers with real-time context.
Detailed Facility Insights
Clicking on any facility marker reveals a pop-up showcasing:
– Real-Time Demand: Immediate visibility into current energy consumption.

– Historical Context: Maximum demand observed within the last 72 hours.
– Dashboard Access: Seamless navigation to detailed facility dashboards for deeper analysis.

Map Settings Customization
Tailoring the Demand Map to specific organizational needs is effortless:
– Facility Clustering: Geographically group icons for streamlined viewing, enhancing scalability and clarity.
– Auto Refresh: Ensure data currency with automatic refresh every 5 minutes, maintaining real-time accuracy.

Why Choose Nsight?
Nsight goes beyond conventional energy management solutions by combining advanced technology with user-centric design. Here’s why organizations trust us:
– Scalability: Manage global portfolios effortlessly with a single, integrated platform.
– Data Integrity: Ensure accuracy and reliability with Ndustrial’s robust data aggregation capabilities.
– User-Friendly Interface: Navigate complex data intuitively, empowering teams at all levels to create a culture of Energy Intelligence™.
Embrace the Future of Energy Management
With the Nsight Portfolio Demand Map, organizations gain a competitive edge in energy management. Whether optimizing operations, identifying trends, or ensuring compliance, Nsight empowers you to make informed decisions swiftly.
Transform your data into action with the Nsight Energy Intensity Platform, the only production-aware energy management platform tailor-made for industrial facilities. Contact BusDev@ndustrial.io to schedule a personalized demo today.

